Thursday morning played out exactly as expected from our weekday effect research - the early session showed immediate weakness right from the opening bell. NQ futures dropped nearly 40 points in the first hour, confirming what the historical data tells us about Thursday’s typically negative early returns.
But here’s where experience separates profitable traders from those who just follow the obvious: while price was falling, the market internals were telling a completely different story.
The Setup: Expected Weakness Meets Divergence
The drop started immediately at 9:30 AM, which aligned perfectly with Thursday’s historical pattern. In our weekday effect research, Thursday mornings show the highest probability of negative returns in the first 30-60 minutes of trading.
However, what caught my attention wasn’t the drop itself - it was what wasn’t happening underneath the surface.
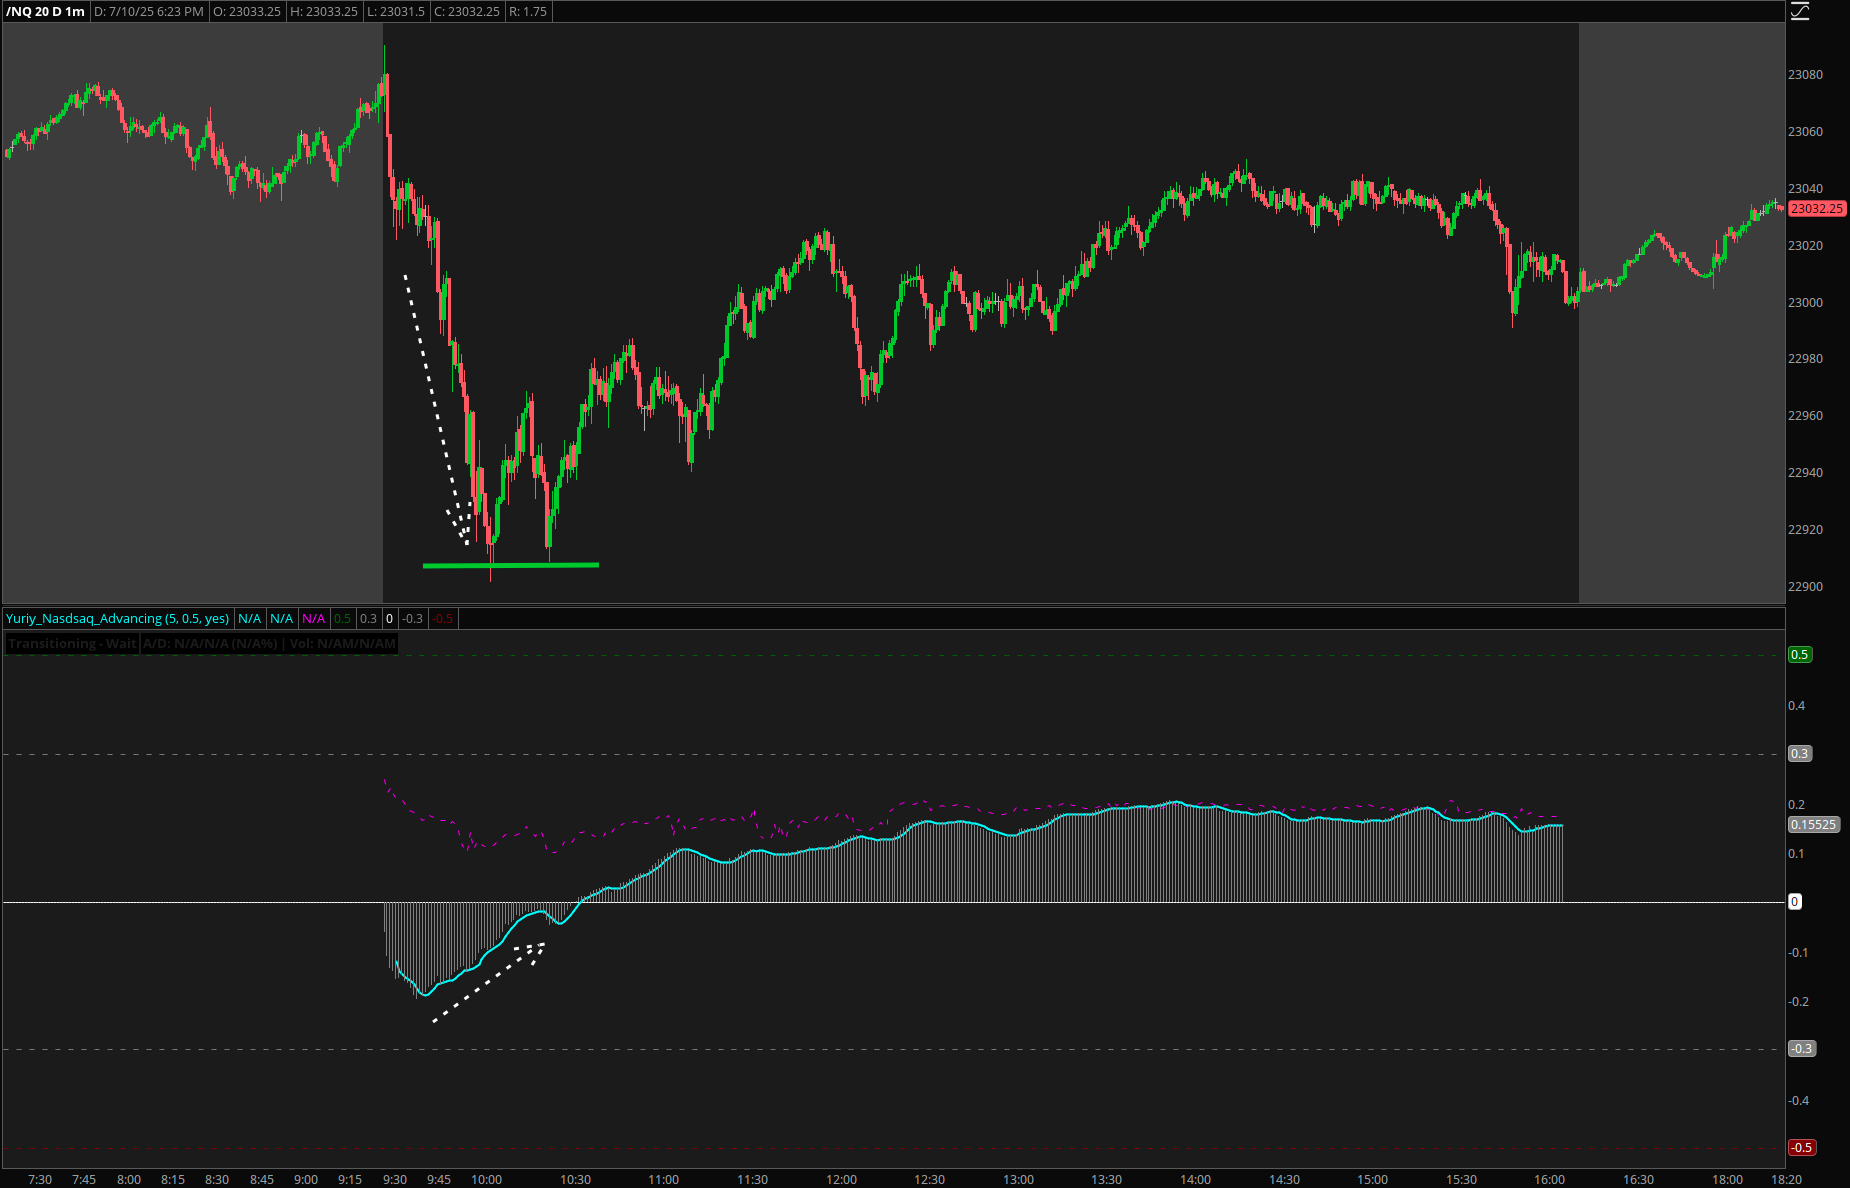
Look at the lower pane in the chart above. While NQ was making new lows around 9:45 AM, the Advancing Declining indicator was doing something fascinating - it wasn’t confirming the weakness at all.
The Divergence Signal
The Advancing Declining indicator measures the ratio of advancing to declining Nasdaq stocks. When NQ falls but this ratio remains stable or even improves, it suggests the selling is concentrated in a few large-cap names rather than broad-based market weakness.
What I observed:
- Price action: NQ dropped from 23,040 to 23,000 in the first 15 minutes
- Advancing Declining: The cyan line held well above its previous lows
- Internal strength: The histogram remained mostly positive despite the price decline
This type of divergence often indicates that while the index futures are falling (driven by a few heavily weighted stocks), the broader market is actually holding up well. It’s a classic setup for a reversal once the selling pressure exhausts itself.
The AO Confirmation
The divergence alone was interesting, but I needed confirmation from momentum before considering any trades. That’s where the Triple AO Wave Rider came into play.
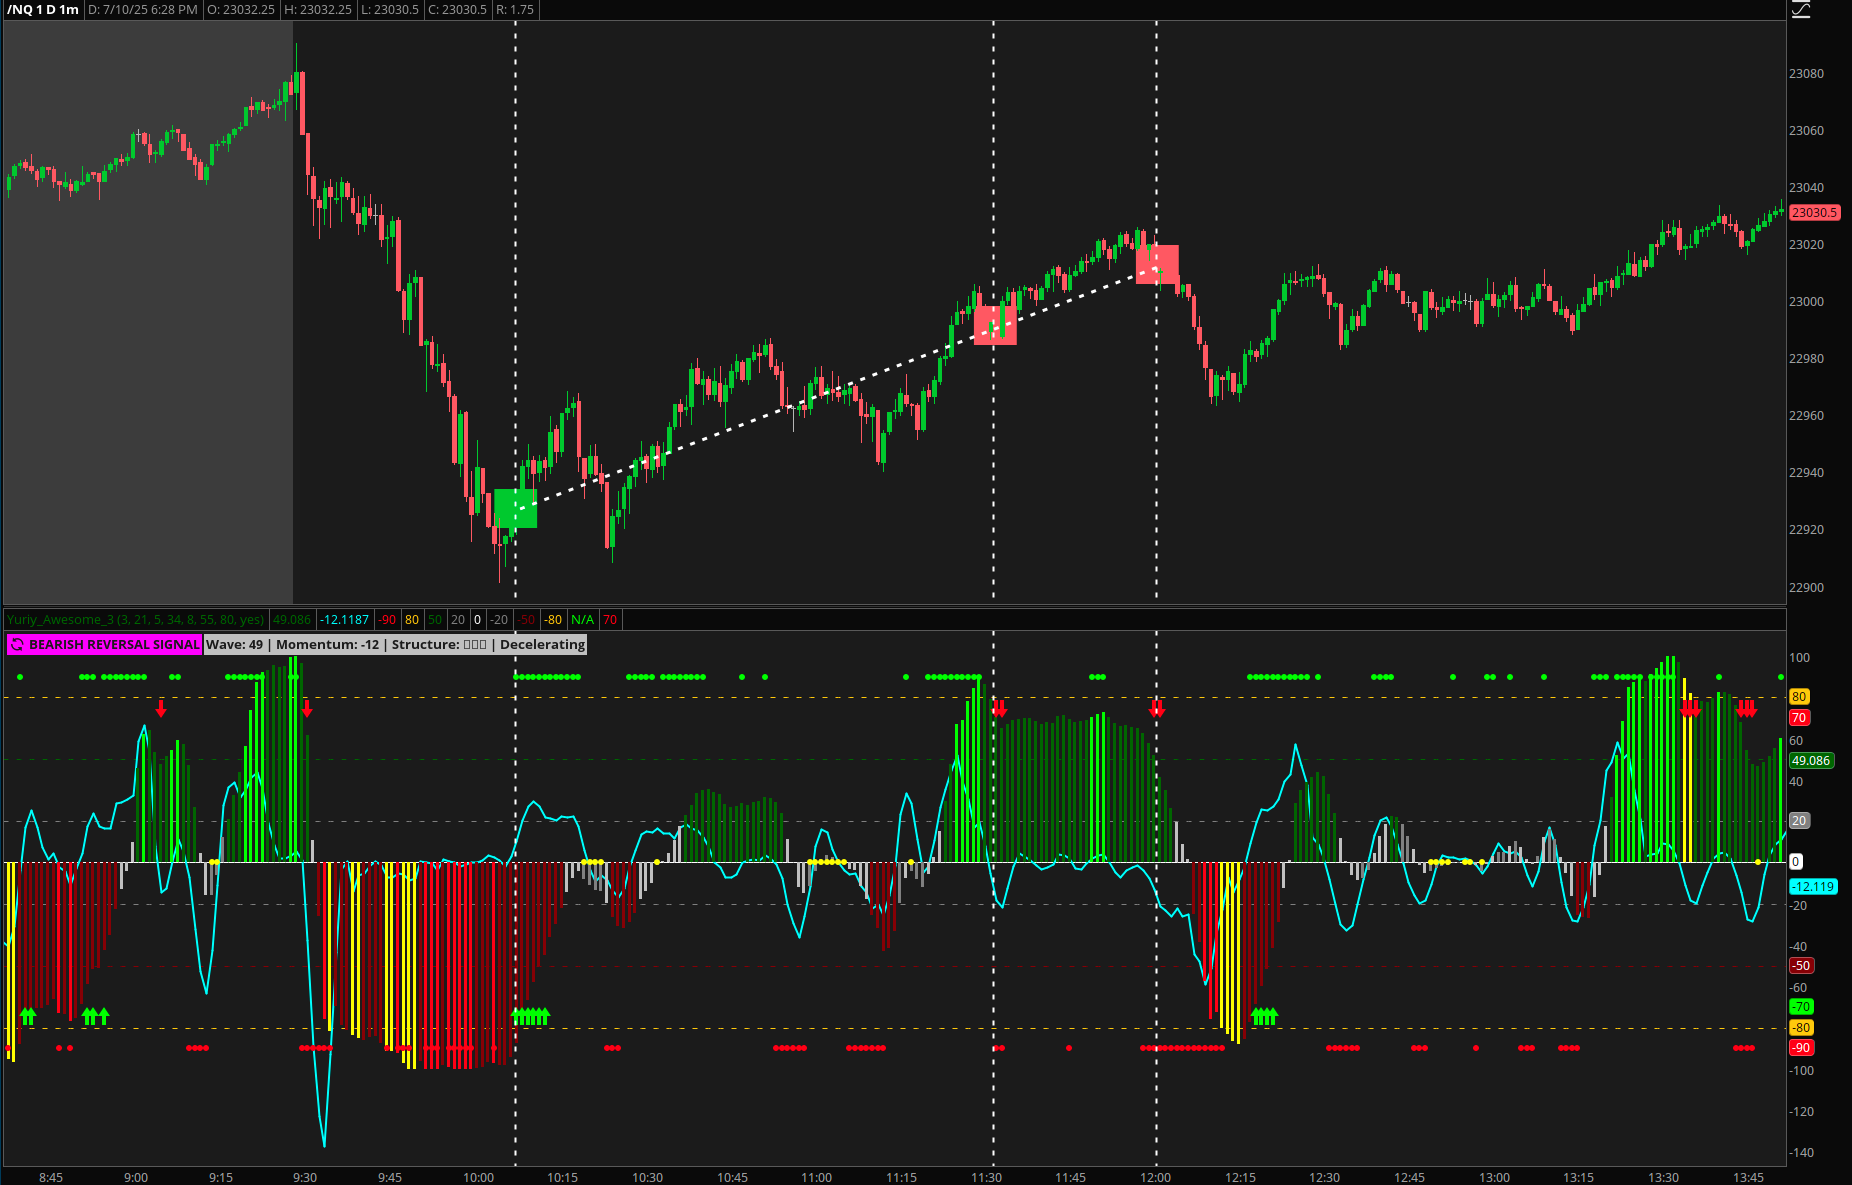
Around 9:45 AM, the Triple AO Wave Rider flashed its bullish reversal signal. You can see the green arrow in the bottom panel, appearing right as the wave score was bottoming out around -50.
The signal breakdown:
- Wave score: Hit oversold levels below -40
- Momentum line: Started turning positive (cyan line)
- Structure: Fast timeframe flipped bullish while price was still falling
- Reversal arrow: Clear green arrow signaling the momentum shift
This combination - divergence from market internals plus momentum reversal - created a high-probability dip-buying opportunity.
Why This Setup Works
This trade combined three powerful elements:
1. Statistical Edge Our research shows Thursday morning weakness is often overdone and typically reverses within the first 2 hours of trading.
2. Internal Divergence When internals refuse to confirm price weakness, it suggests the selling is not broad-based and likely to exhaust quickly.
3. Momentum Confirmation The Triple AO Wave Rider eliminated the guesswork by providing a clear, objective signal when momentum was shifting from bearish to bullish.
Key Takeaways
1. Don’t just trade price action - market internals often give earlier and more reliable signals than price alone.
2. Use multiple timeframes - the AO’s multi-timeframe approach helped confirm the reversal across different momentum periods.
3. Respect the research - Thursday morning patterns are well-documented, but the key is recognizing when they’re setting up for reversals rather than continuations.
4. Wait for confirmation - divergence is interesting, but momentum confirmation provides the timing for actual entries.
This trade perfectly demonstrates why having the right indicators matters. Without the Advancing Declining divergence, I might have assumed the selling would continue. Without the AO reversal signal, I might have entered too early or missed the setup entirely.
The best trades often come when what you see on the surface contradicts what’s happening underneath - and having the tools to spot those discrepancies makes all the difference.