Cumulative TICK
Overview
The Cumulative TICK indicator transforms chaotic tick-by-tick market data into a clear directional signal by tracking the running total of buying versus selling pressure throughout the trading day. Unlike individual TICK readings that can be erratic and noisy, the cumulative approach smooths out short-term fluctuations to show the underlying directional bias. Think of it as seeing the tide rather than individual waves - it gives you the bigger picture of institutional money flow and reveals whether bulls or bears are truly in control beneath the surface price action.

Key Benefits
Discover what makes this indicator powerful for your trading
Reveals Hidden Market Bias
Shows the true underlying strength or weakness that individual TICK readings might miss. When you see consistent positive cumulative TICK values, institutions are net buyers regardless of short-term price fluctuations.
Trend Confirmation
Validates whether price movements align with actual buying/selling pressure. Rising prices with negative cumulative TICK suggests underlying weakness - a warning sign that the move may not be sustainable.
Early Reversal Detection
Divergences between price and cumulative TICK often precede major turning points. When price makes new highs but cumulative TICK fails to confirm, it's a powerful reversal signal.
Day Structure Recognition
Distinguishes between trend days and range days by analyzing cumulative TICK patterns. Trend days show one-sided cumulative TICK values, while range days oscillate around zero, helping you choose the right trading strategy for each market environment.
Institutional Flow Tracking
Reveals the true direction of institutional money flow by accumulating individual TICK readings throughout the session. Unlike individual TICK spikes that can be misleading, cumulative values show sustained buying or selling pressure from large market participants.
Noise Reduction & Signal Clarity
Transforms chaotic tick-by-tick market data into smooth, actionable signals by filtering out random market noise. The cumulative approach eliminates false signals and provides clear directional bias that individual TICK readings cannot offer.
Applications
Reversal Detection
All three Cumulative TICK indicators (on Nasdaq Composite, Nasdaq 100 and NYSE) reversed down suggesting that the intraday rally was fading. This offered an early trend reversal opportunity.
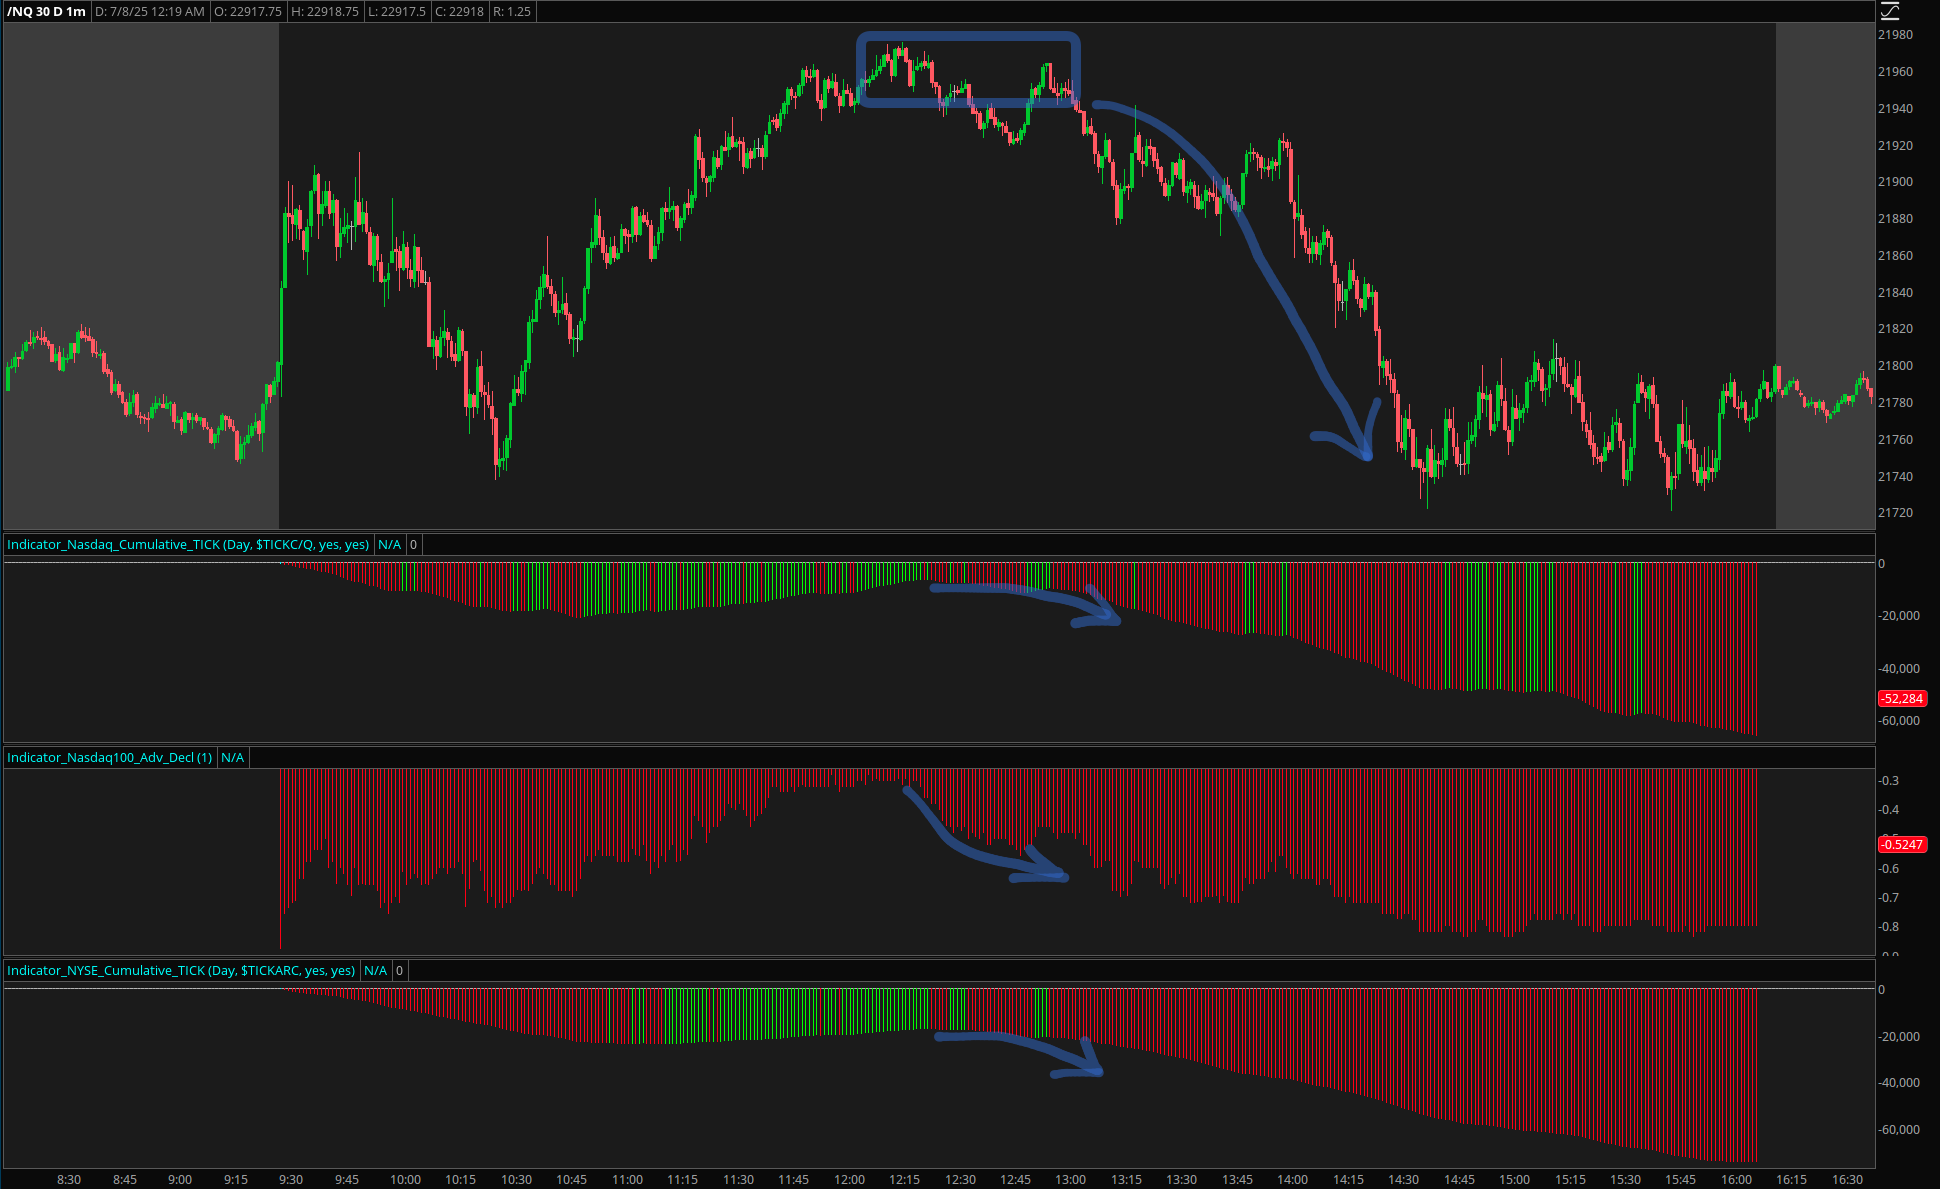
Cumulative TICK Reversal Detection
Trend Confirmation
The Cumulative TICK remained strongly positive throughout the uptrend, confirming the price advance with underlying buying pressure. This alignment between price action and cumulative breadth validates the sustainability of the move and provides confidence to stay with the trend.
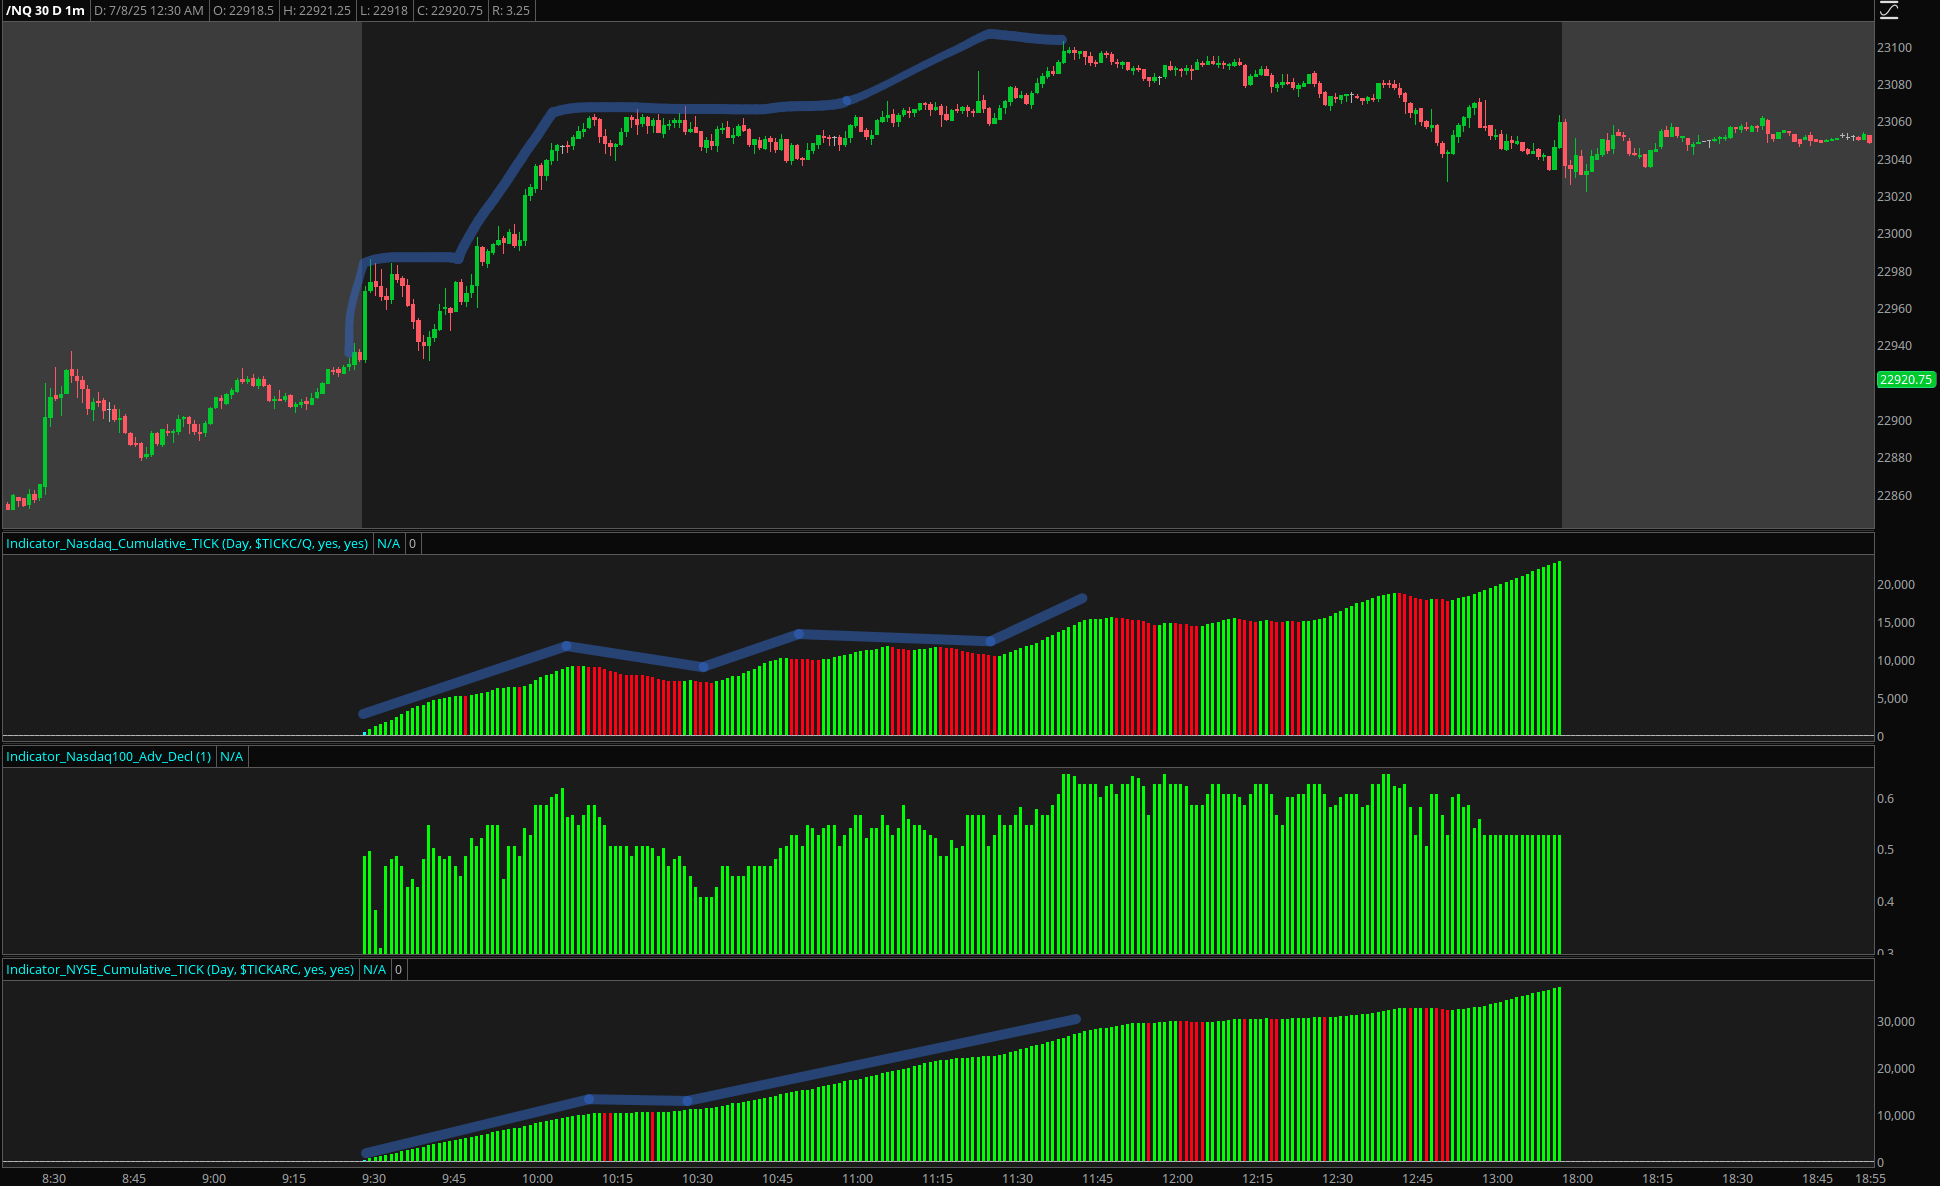
Cumulative TICK Trend Confirmation
Dip Buying
The price started to correct aggressively, however, all of the Cumulative TICK indicators were above zero and NYSE continued to trend higher. This suggested that this intraday drop could have been bought, as the underlying market breadth remained supportive despite the surface price weakness.
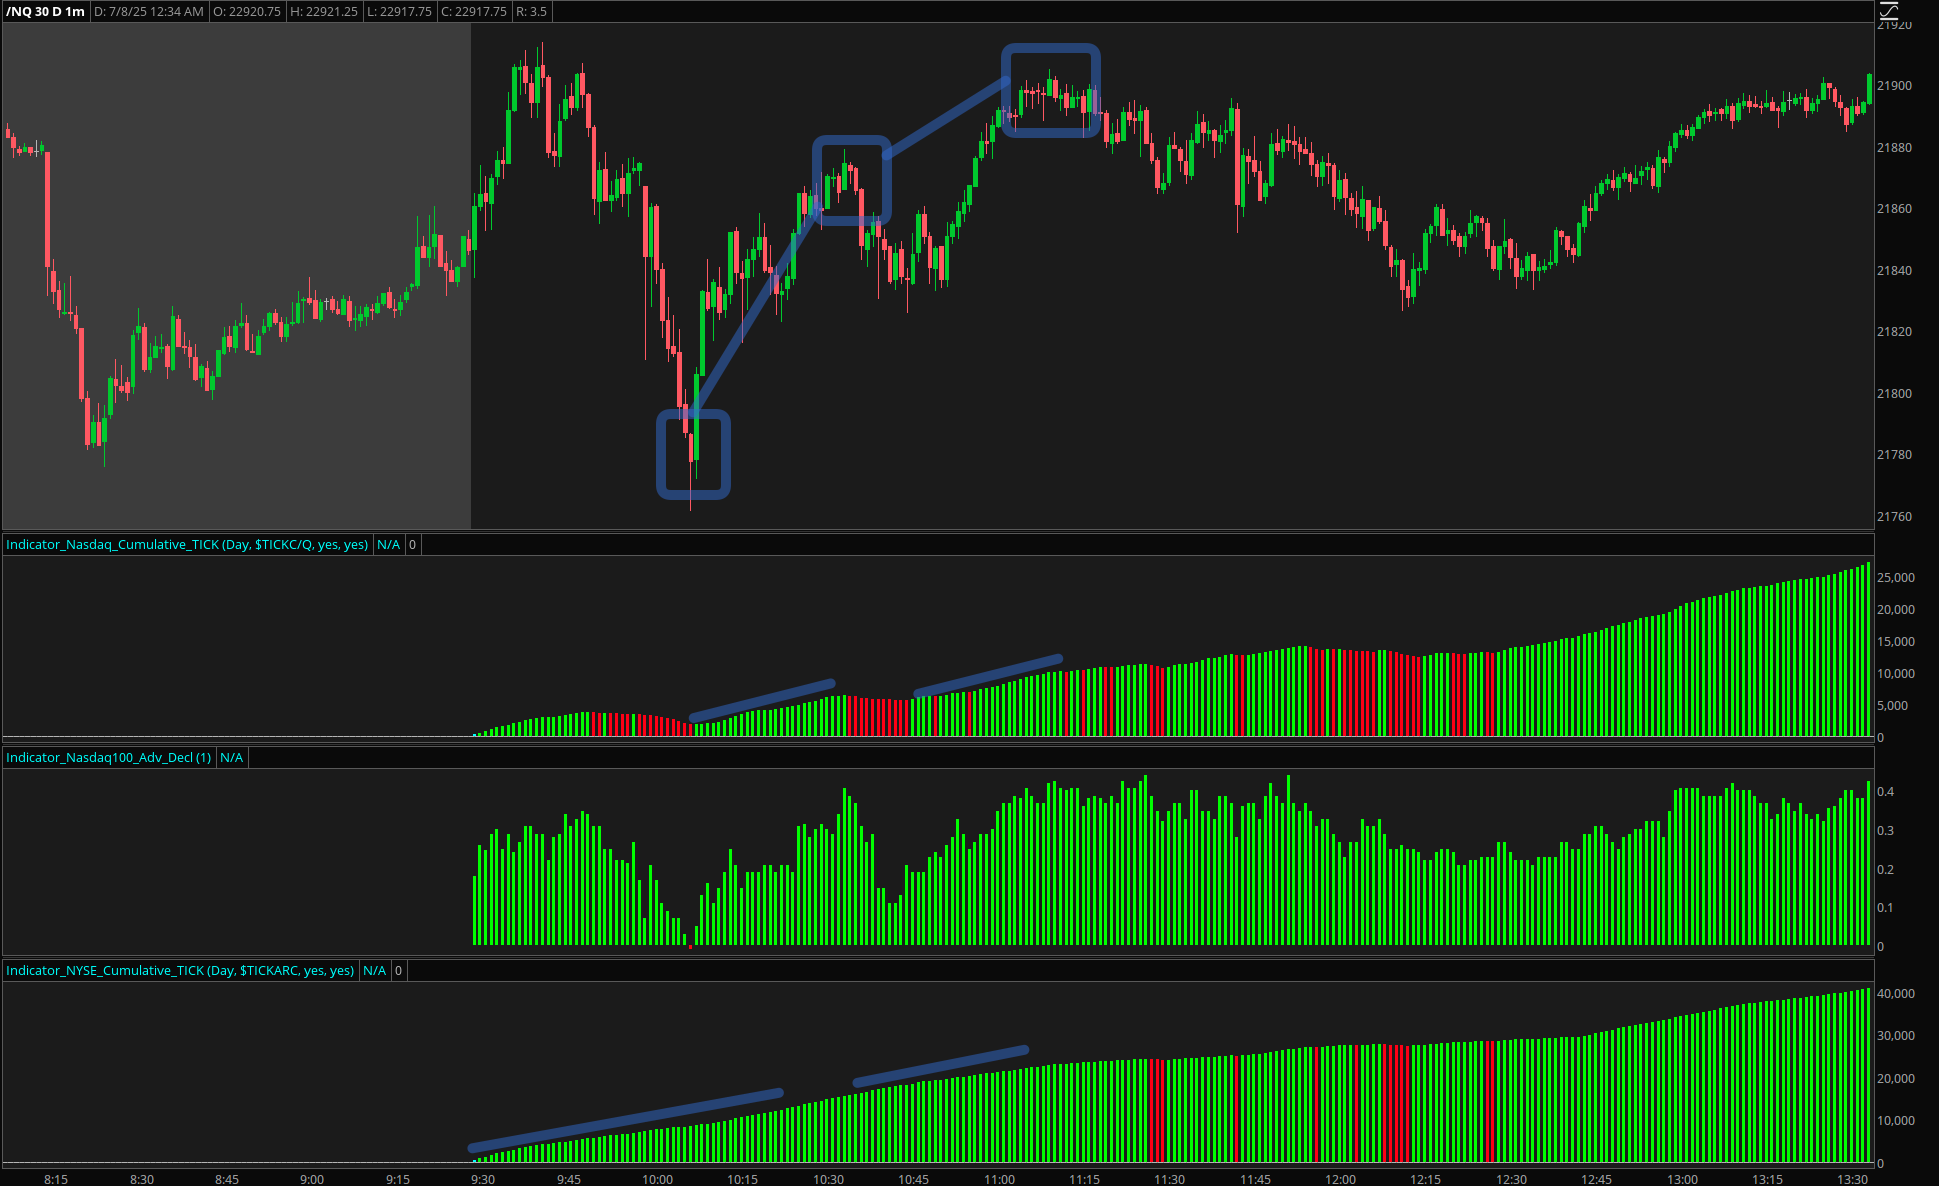
Cumulative TICK Dip Buying Opportunity
How to Access This Indicator
To access this indicator, you need to purchase the Premium Indicator Bundle.
Once the bundle is purchased, you will receive access to the complete ThinkScript code via Google Drive along with detailed instructions on setting up this and other indicators. You will then be able to save them in your ThinkorSwim platform and start using them in your day trading.