Technical Setup Aligns on Multiple Timeframes
The S&P 500 futures (ES) are displaying a powerful combination of bullish technical patterns that often precede significant moves higher. Let’s break down what’s happening on both the daily and hourly timeframes.
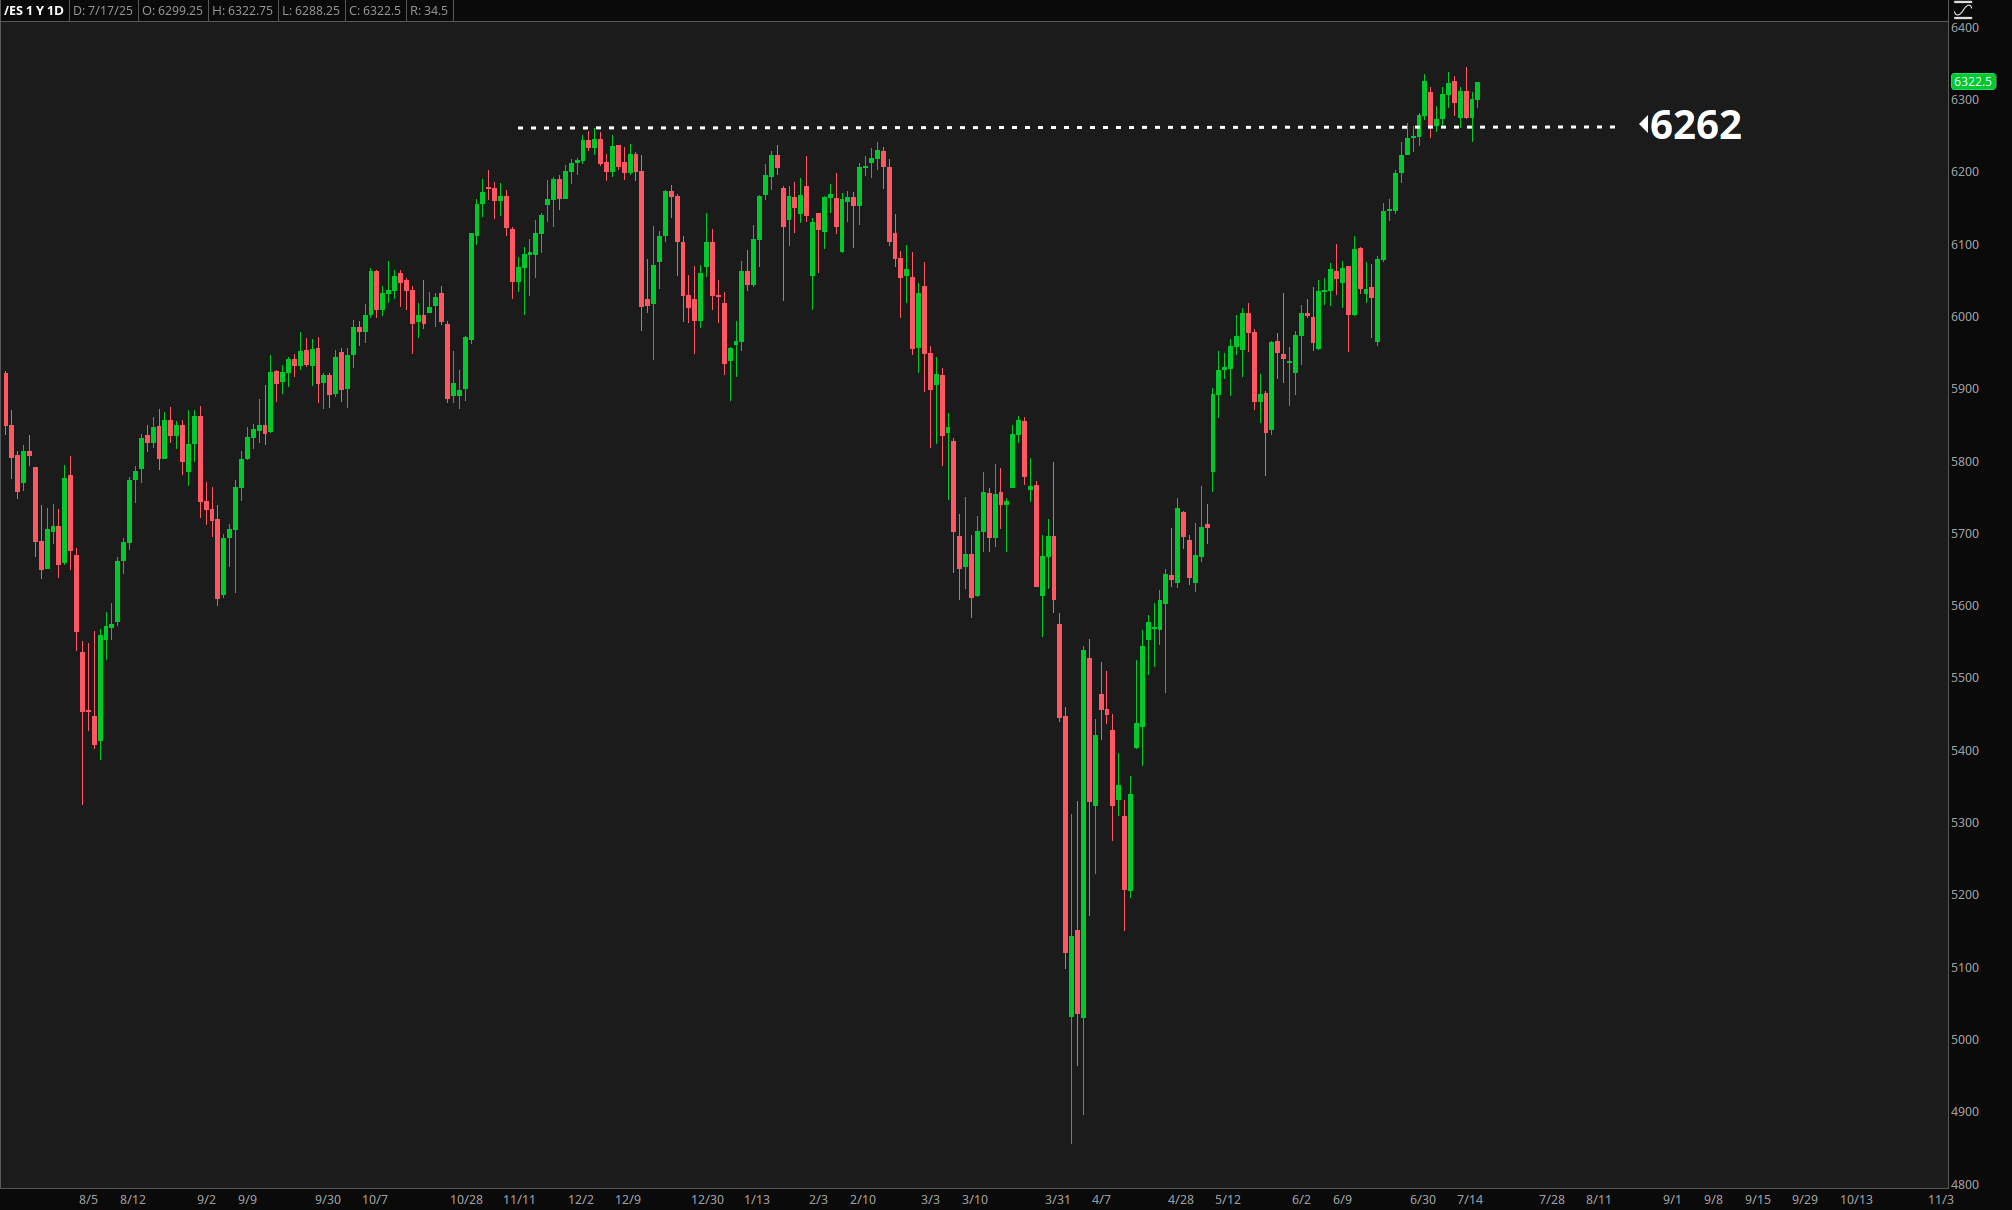
Daily Chart: Former Resistance Becomes Support
The daily timeframe tells a compelling story. After breaking above the 6260 level last week, ES has now pulled back to test this level from above. This classic “resistance becomes support” pattern is one of the most reliable setups in technical analysis.
Key observations:
- 6260 acted as resistance multiple times in recent weeks
- Clean breakout above this level with strong volume
- Current pullback testing 6260 as new support
- Buyers stepping in right at this critical level
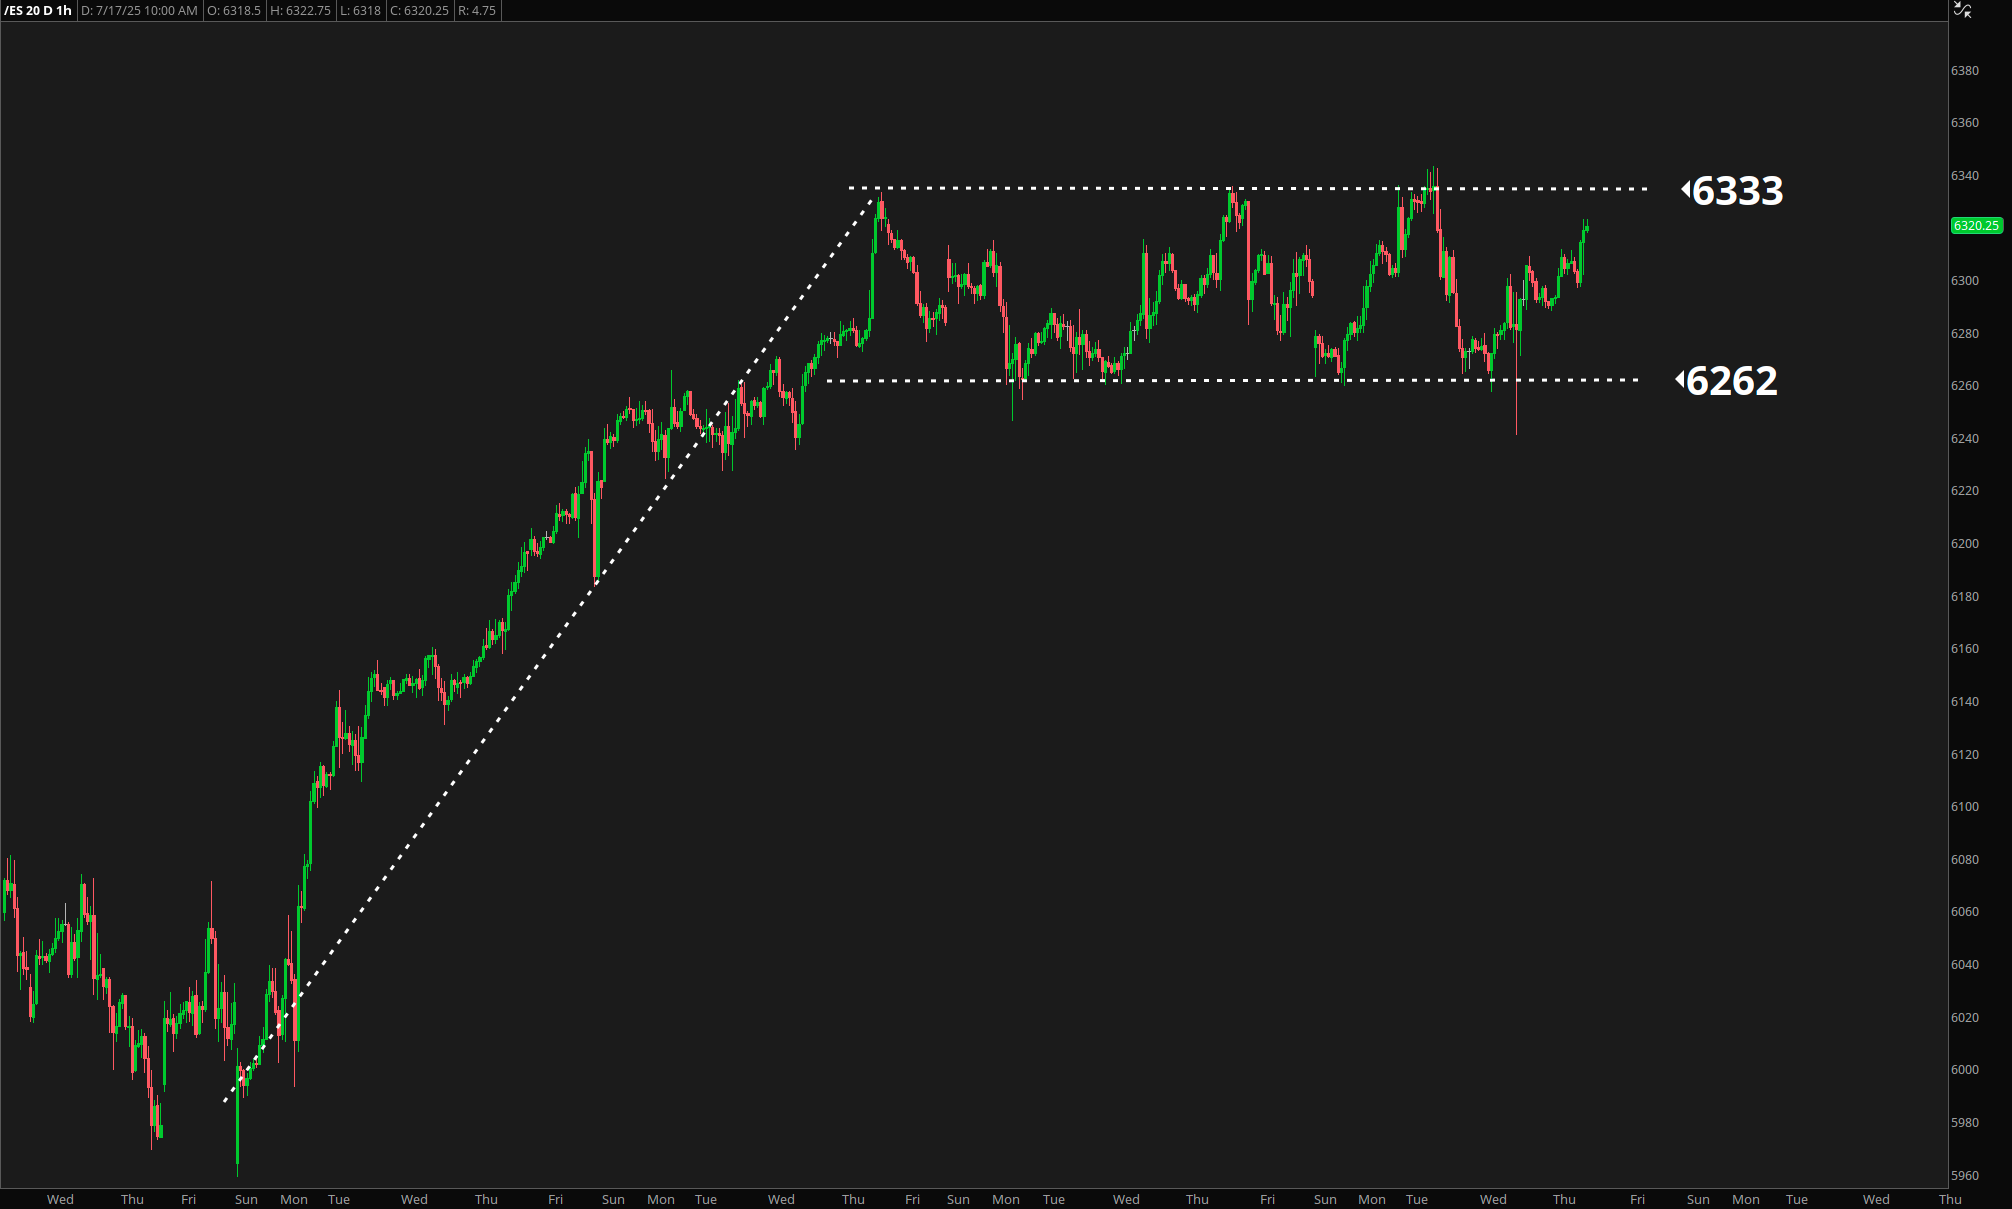
Hourly Chart: Textbook Bull Flag Formation
Zooming into the hourly timeframe reveals an even more exciting development - a classic bull flag pattern. This consolidation pattern forms after a strong move up (the flagpole) followed by a parallel channel pullback (the flag).
Bull flag characteristics:
- Sharp rally from 5960 to 6333 forms the flagpole
- Orderly pullback in a sideways channel
- Volume declining during consolidation (typical for flags)
- Pattern nearing completion at support
The Critical 6333 Resistance Target
For this bullish setup to play out, ES needs to clear and hold above 6333. This level represents:
- Measured move target from the bull flag pattern
- Previous swing high from earlier this month
- Psychological resistance at this round number area
A decisive break above 6333 would confirm the pattern and open the door for a move toward 6350-6360.
Bottom Line
ES futures are setting up nicely with converging bullish patterns on multiple timeframes. The combination of daily support holding at former resistance (6260) and an hourly bull flag pattern creates a high-probability setup for continuation higher.
All eyes on 6333 - a break above this level with volume would signal the next leg up is underway. Until then, patient traders can look for entries near support with clearly defined risk.
Remember: Technical patterns provide roadmaps, not guarantees. Always manage risk appropriately.